HY Market Updates
HY spreads remain historically tight with the index sub-400. Dispersion across credit rating buckets is heading back to highs for the year. Despite initial concerns surrounding economic uncertainties and market volatility, HY credit markets have displayed resilience and experienced a steady recovery. The issuance of HY bonds has been robust, supported by accommodative monetary policies and investor appetite for yield. Default rates have remained relatively low, aided by improved corporate profitability and effective risk management. Comparatively, when looking back to historical credit markets dating back to the 1980s, the current HY credit environment showcases enhanced credit quality, more rigorous risk assessment methodologies, and increased regulatory oversight. Lessons learned from past credit cycles have contributed to the evolution of market practices, resulting in a more robust and stable HY credit landscape.
HY Corporate Index: 387 (-82 YTD)
HY Corporate Index Total Return: 5.43% YTD
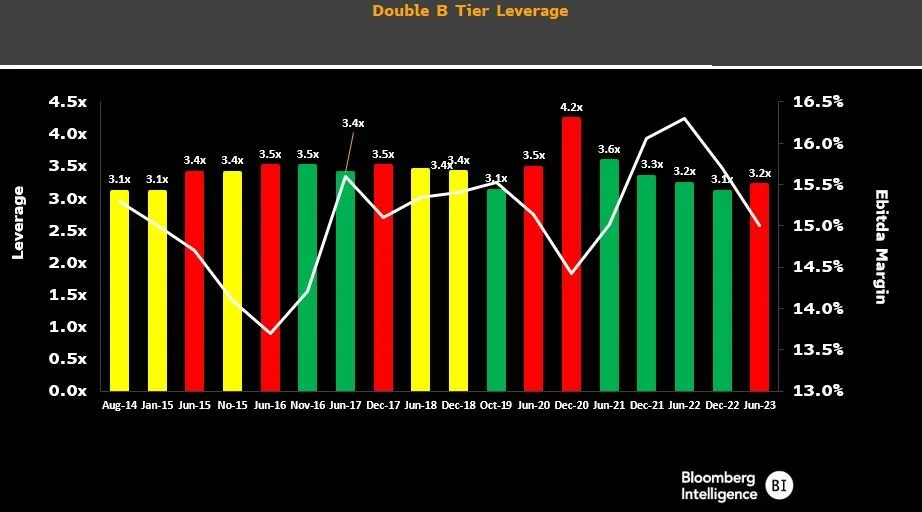
BB leverage has crept upward meanwhile B leverage metrics show improvement
BB vs BBB spread ratio show reversion with spread preference favoring BBB
Fig 1 : Leverage creep is beginning to pick back up in the BB Tier Index and EBITDA margins are deteriorating
Below are several time series charts I’ve pulled using data from BQNT and exported to a pdf file to show weekly spread trends across multiple indices.
Looking at secured vs unsecured HY bonds also lends it’s self to trade opportunities. There are plenty of ways to quickly screen and create tables in BQNT.


